In this upcoming sequence of lessons, we will cover how we can write computer programs that create graphical outputs onto a computer screen. Up to this point, all of the outputs that our programs have been producing has been text to the output console (we call this “standard output” in programming). Here, we begin to discuss another kind of output, which is visual graphics in a window on your screen. There are other types of output computers can produce (for example, writing content to a file on the file system of your computer) but that is discussed in other lessons.
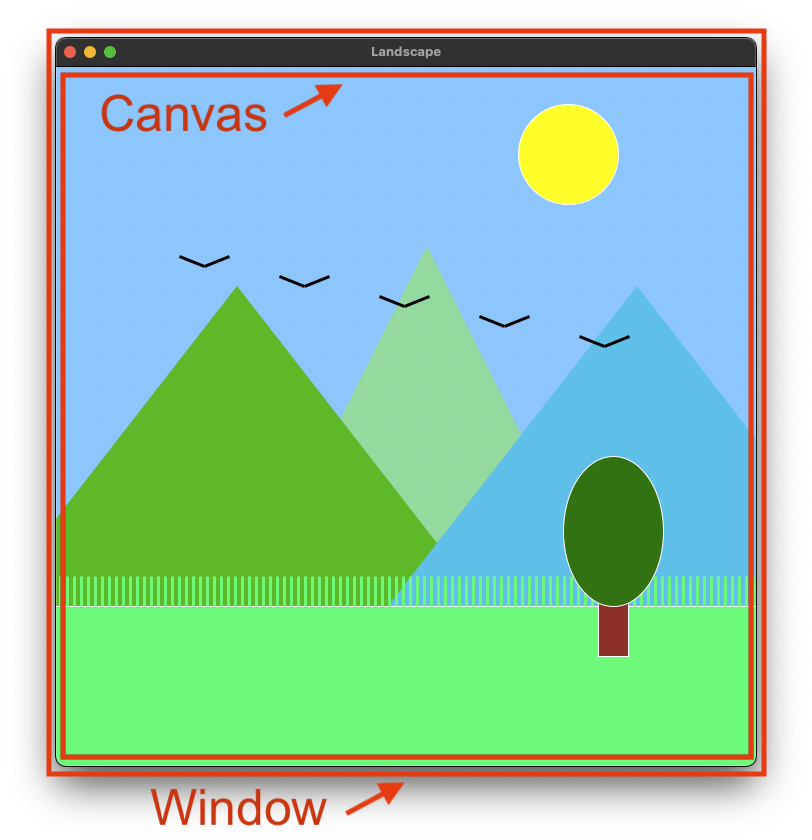
Before we get into how to write python code to do with, you need to have a foundational understanding of application windows, a graphics canvas, and the coordinate system we will use to “draw” elements onto our screen. When we use laptop and desktop computers, we generally view the applications that we are using within a window. For example when you launch your web browser (say, Google Chrome or Apple Safari) a new “window” pops up on to your screen, and renders the necessary content within that zone of the computer screen. In some cases, rather than a window appearing within the larger screen, we launch applications that take up the full screen real-estate. This often happened with applications on phones, for example. Even in this case, we can still think of the application as running within a window, that just-so-happens to use the entire screen, the rest of the operating system is still function in the background.
These applications have code that causes a window to launch, and then we can write code to draw things onto these screens, as well as respond to things that users do within the window (for example, clicking on it with the mouse pointers). We can also write python programs that do just this, which we will see in the upcoming lessons. There is also the concept of the graphics “canvas”. This is the area within the window that is are actual, drawable space. This is the area that does not include the close button, top title bar, etc.
The canvas is what we get to control from our python program.
In this area, we can draw shapes text, buttons, images, and really, anything that is display-able by a computer screen.
There are different techniques for displaying things onto a graphics canvas.
Much of it depends on the language a programmer chooses to use, what kinds of things you want to draw, etc.
For our purpose in these lessons, we will be using a custom graphics programming library simply called graphics.py.
There will be a download link for this in the next lesson.
This is a library that can be imported into our programs, and under-the-hood this library used python TKinter.
Within the canvas, we need a way to tell python where we want to draw components.
We will specify these things with an X / Y coordinate system.
This is more-or-less the same system that you likely learned about in algebra class in high-school.
There are two axes, X (which specifies a location on the left / right plane) and Y (which specifies locations on the up / down plane).
Having this allows us to pinpoint any location on a canvas.
Thus, and location can be designated with a pair of numbers, (X, Y).
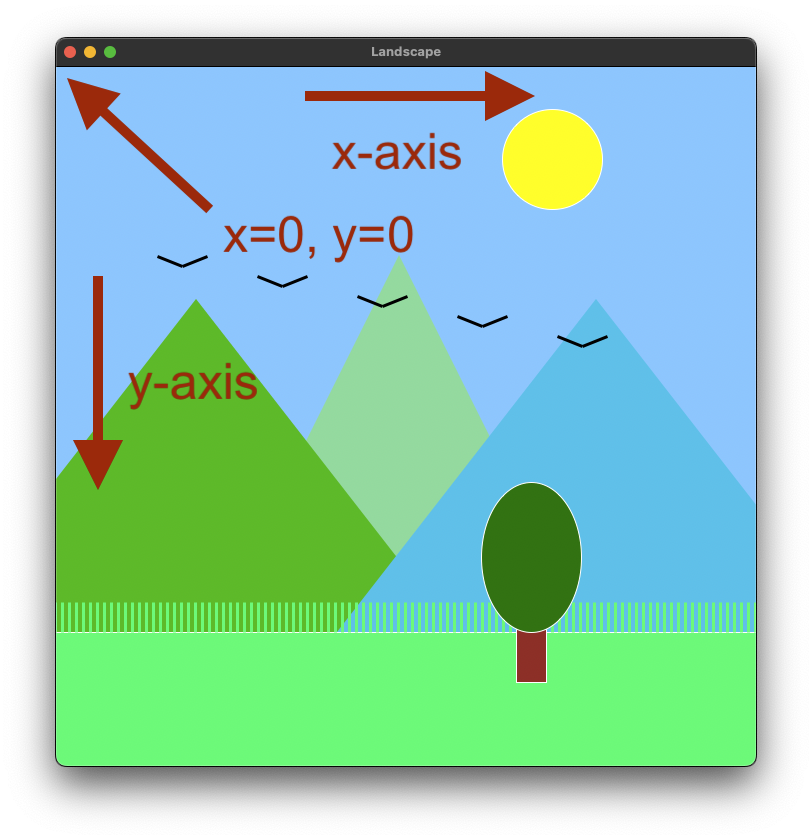
One of the key differences between this coordinate system and the one from math class is that the origin points (where X and Y are zero) is at the top-left corner of the screen. In addition to this, values grow downward on the Y axis instead of upward. For example, if we were to tell a program to “put a black circle at the coordinate X=10 and Y = 100,” this would place the dot 10 pixels from the left edge of the window, and it would place it 100 pixels down from the top. The units of this coordinate system are the pixels of our screen. Modern computer screens are made up of grids of pixels, and a window on a screen takes up a sub-section of that grid. When we talk about distances in X and Y, we are referring to the pixel sizes of the screen (rather than say, inches or centimeters).
As an example, let’s say that the landscape canvas shown in the example is 700 pixels wide by 700 pixels tall. If that’s the case, we can start to specify different locations on the screen, such as:
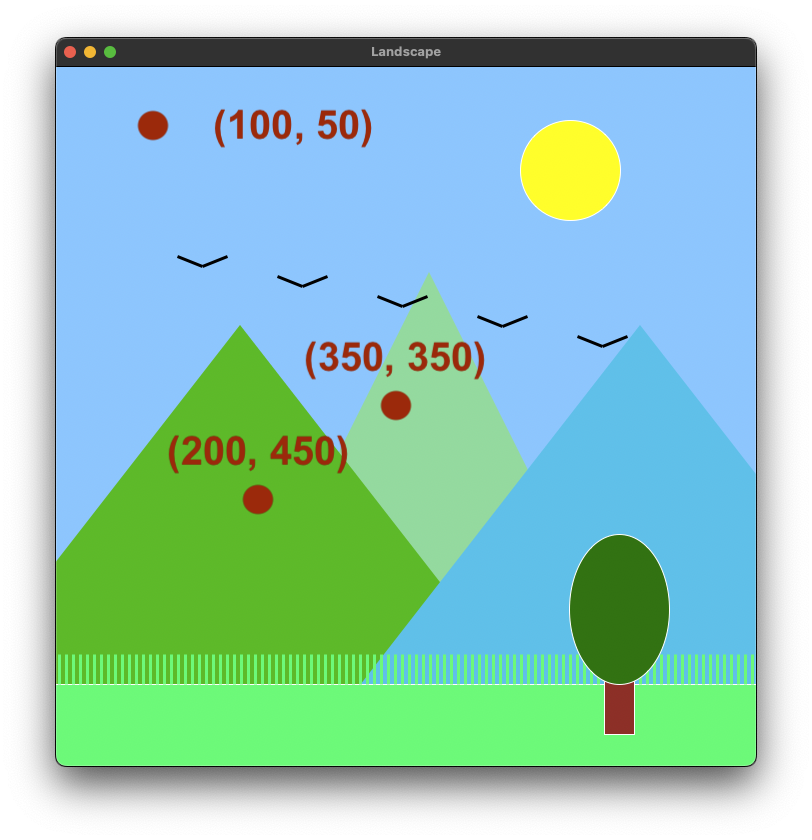
You may find it helpful to a bit of experimentation on your own with this too. Pick some random points on the canvas shown above, and then try to calculate the approximate X and Y value of that location. This skill will be very useful when it comes time to start drawing shapes of you own. Next up, we will learn how to create canvases and draw simple things to the screen, using python.